System Design Case Study: Monitoring System
Step1: Scope the problem
some good questions:
- who we are building the system for?
- what metrics we want to collect?
- what’s the scale of infrastructure
Let’s assume here is the key features of our system:
- infrastructure being monitored is large-scale
- variety of metrics can be monitored: CPU usage, Request counts etc.
Step2: High level design
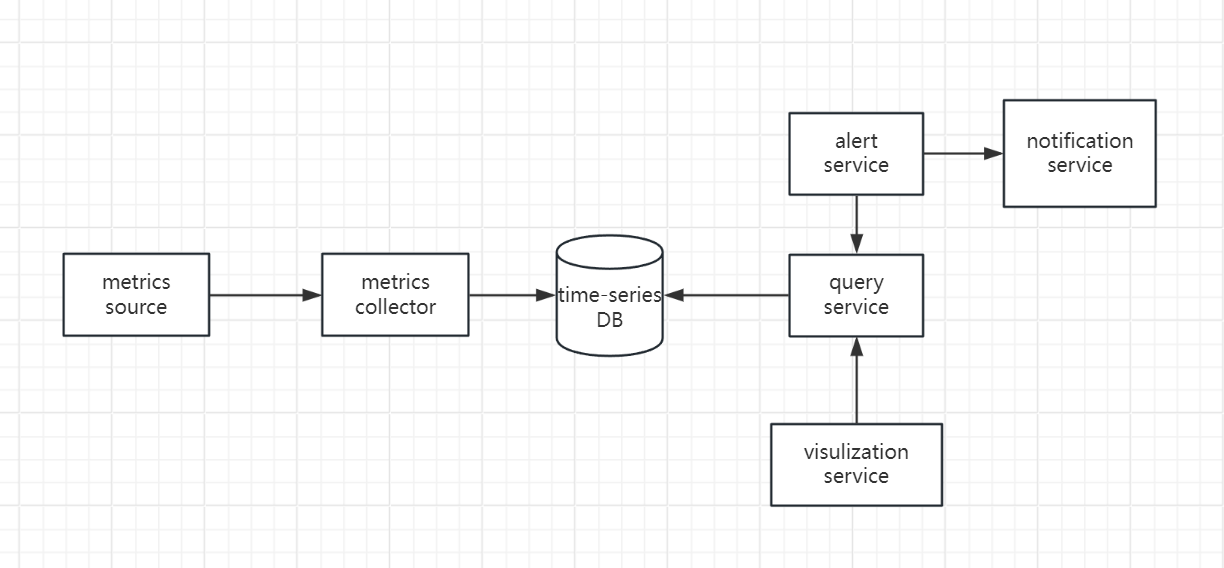
A metrics monitoring system should generally contains 5 components:
- Data Collection
- Data Transmission
- Data Storage
- Alerting
- Visualization
Data Model
Metrics Data is usually recorded as a time series that contains a set of values with their timestamps.
Every time series consists of following:
- a metrics name
- a set of tags/labels
- an array of values and their timestamps
Data Access Pattern
Write load is heavy. At the same time, read time is spiky.
Data Storage System
It’s not recommended to build your own storage system or use a general purpose storage system.
There are many storage system that are optimized for time-series data.
According to DB-engines, the two most popular time-series databases are influx DB and Prometheus.
High Level Architecture

Step3: Design deep dive
Metrics Collection
Pull v.s. Push mode
There are two ways metrics data can be collected. and there is no clear answer which one is better.
- pull model:
- metrics collector fetches the configuration metadata of service endpoints from service discover.
- metrics collector pulls metrics data via pre-defined HTTP
- a single collector is not able to handle thousands of servers. We can designate each collector to a range in a consistent hash ring.
- push model
- a collection client is commonly installed on every server being monitored. client is a piece of long-running software that collects metrics from service
- aggregation is an effective way to reduce the volume of data sent to metrics collector.
Metrics Transmission
There is a risk of data loss if the time-series database is unavailable, to mitigate the problem, we should introduce a message queue between data collector and time series DB
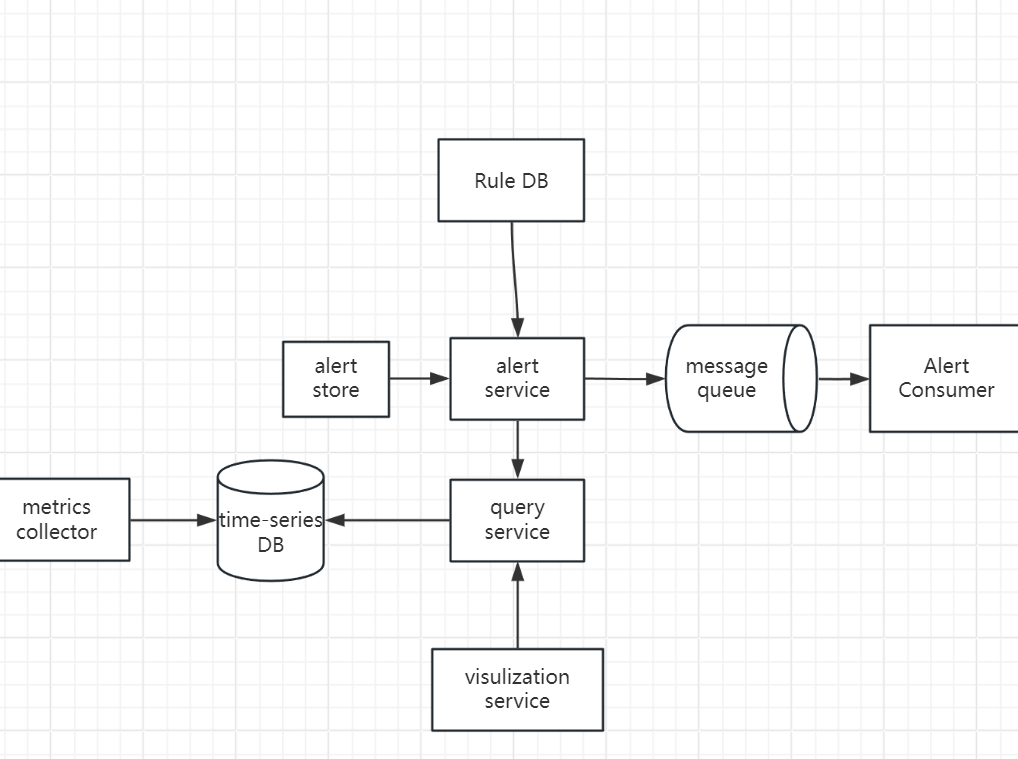
Alerting System

- rules are defined as config files on the disk
- load config file to alert manager
- based on config rules, alert manager calls the query service
- if the value violate the threshold, an alert event is created
- send notification and ensure it’s sent at least once
- eligible alerts are inserted into message queue
- alert consumer pull alerts event from message queue
Step4: Wrap Up
In this article we go through how to design a monitoring system.
Some takeaways:
- A monitoring system should have 5 components:
- data collection
- data transmission
- time series DB
- alert
- visualization
- data collection has two possible mode: pull or push, without preference, each one has its advantage and drawbacks
- data transmission might have data loss risk, so we introduce message queue to mitigate it
- time series DB is specialized for monitoring system
- the basic flow of alert service: rule config -> query -> notification
